Visualisations

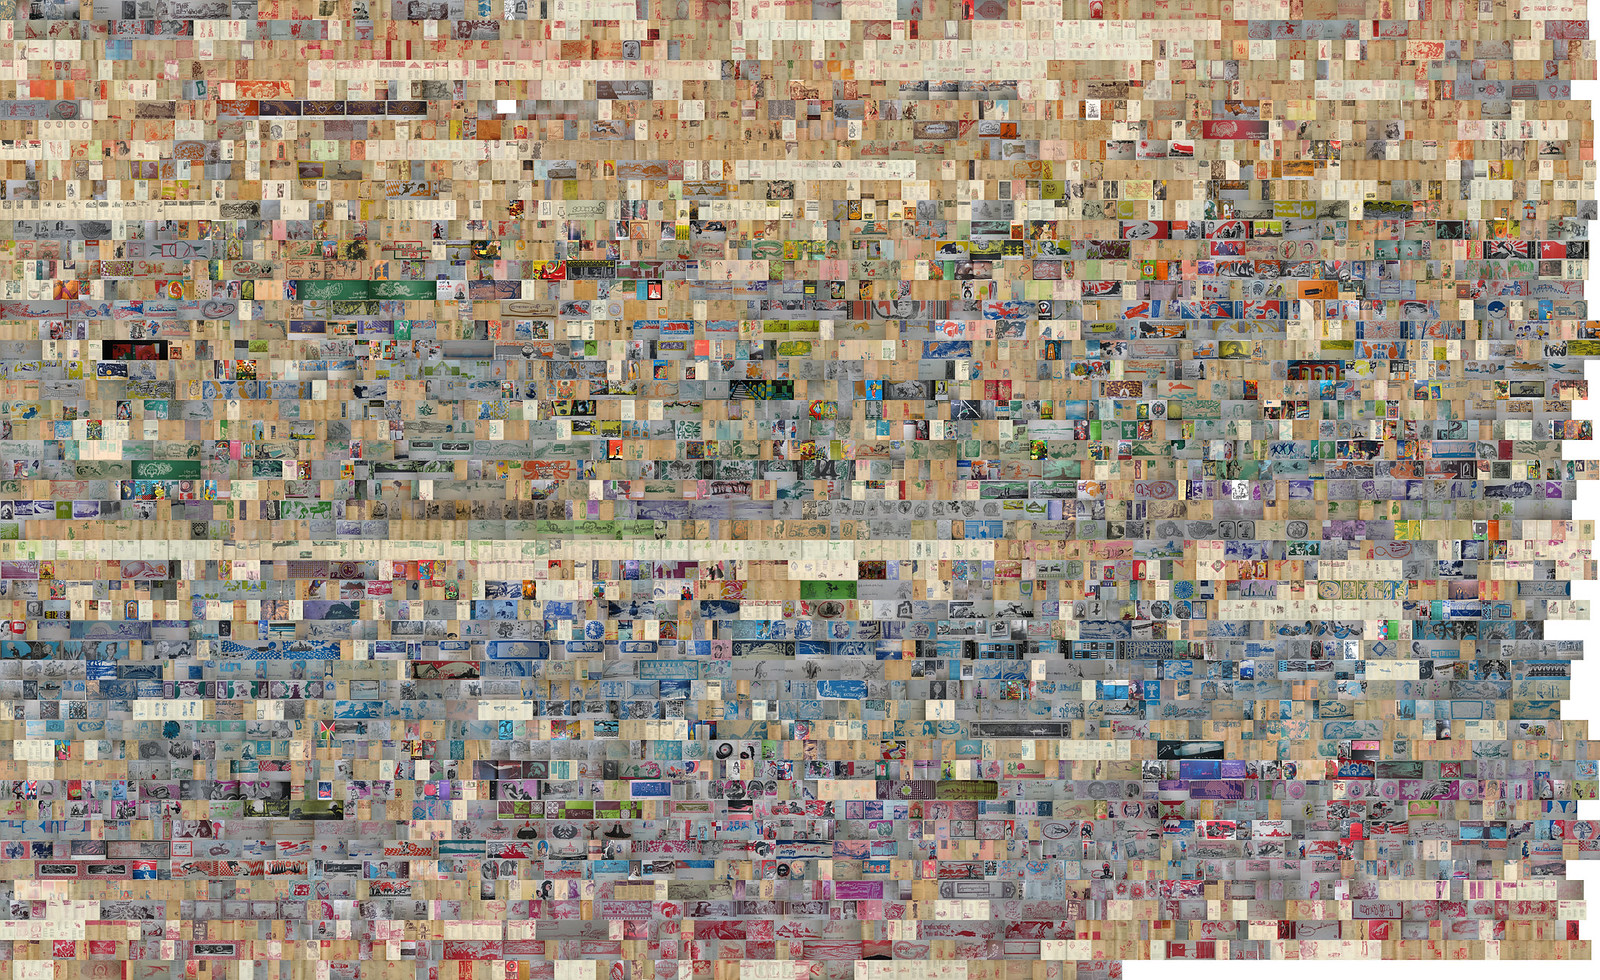
Montage of illustrations by Bagyi Aung Soe between 1948 and 1990 – Generated using Image Montage using ImageJ.
Breakdown of the Database
Colour Analysis
Hue values of Bagyi Aung Soe Illustrations from 1948 to 1990. The polar visualisation was generated using ImagePlot macro on ImageJ. Mean of hue values were calculated and derived from identified dominant colours in each illustration. The values are then plotted against the publication years of the illustrations with the earliest illustrations from the center.
WATCH THIS SPACE… More visualisations coming.
We are in preparation for AUNGSOEILLUSTRATIONS.ORG‘s official launch at the end of 2017.
In the meantime, we seek your kind understanding with regards to the technical and human errors present in the documentation of materials.